
Section 2: Review data

Is this section for me?
After assessing your readiness, we recommend organizations continue onto this section for guidance on reviewing data to understand local context and needs. However, some organizations have already reviewed their data. Before beginning this section, let’s see if you have already completed this work.
Have you already looked at data that helps you understand what is happening and decide what to do next? Have you considered changes you’d like to see that HOPE implementation could help with?
If so, you’ve completed this step and can move on to the next section, Choosing your implementation project, or you can read this section to make sure you are happy with your review of the data.
Introduction to reviewing data
Looking at your data means paying attention to information you already have, including information you hear and see every day, to better understand what is happening in your system. This step is not about analyzing everything you have. It is about learning enough to make a thoughtful next decision about what changes you’d like to implement and what impact you hope to see because of your implementation of the HOPE framework.
Data can include: quantitative data (numbers, counts, percentages, trends), qualitative data (themes from surveys, interviews, conversations, focus groups or written feedback), and anecdotal data (patterns and observations from day-to-day work).

Teams arrive at this step in different ways. Some teams look at data first to help decide what to work on. Others come in with a project idea and use data to test, refine, or focus it. In both cases, looking at data helps because:
- It grounds decisions in more than instinct or urgency
- It helps teams avoid taking on work that is too broad or unclear
- It brings clarity to what is most important and doable
This step can help you identify a project or strengthen one you’re already considering. Regardless, the goal at this point is not to prove a point or confirm assumptions – it is to learn.
A helpful way to approach this step is with questions. Clear questions help teams stay focused and avoid feeling overwhelmed.
How this step fits into the larger QI process
Looking at the data comes immediately after assessing your team’s and organization’s readiness to implement the HOPE framework. It should help you:
- Narrow from many possible needs to a few realistic priorities
- Identify where improvement might make the most difference
- Choose an implementation project that fits both the data and your current capacity
This step connects readiness with the remaining, action-oriented steps of the QI process by providing you with the information you need to develop an aim (or goal) that is informed, focused, and realistic. If you already have a project idea in mind, check whether the data supports, sharpens, or challenges that idea.
Guidance and questions to ask
Readiness has more than one dimension. While every organization’s context is different, there are a few common areas that tend to shape how easily an improvement effort can move forward.
There’s a lot of data out there, and it is tempting to try to look at everything. But more data does not always mean more clarity. In fact, it can often make things more confusing. Pick one or two key questions to start with.
- What are we trying to understand better?
- What would help us decide what to work on?
- What would be useful to know right now?
You do not need perfect questions, and you do not need to answer everything right away.
Identify a few data sources that might help you answer your questions. Try to include a mix of quantitative, qualitative, and anecdotal data. Different types of data often tell different parts of the same story.
Before collecting anything new, take time to understand what data already exists, what you can access, and the format in which this data appears. This may include:
- Data your organization already collects (intake forms, surveys, participation logs)
- Data required for reporting or funding
- Local, state, or national data sources
- Dashboards or reports used by partners or coalitions
Ask yourself:
- What data are we already collecting, even if we do not always use it?
- What data can we access through partners, funders, or public dashboards?
- What does this data help us understand?
- What questions could this data help answer right now?
Teams often realize they already have more useful information than they thought!
Try to select data sources that meet your team’s comfort with and capacity for data interpretation. Data is typically available in three forms:
- Easy to interpret: Data from sources that have already interpreted and summarized for readers.
- Some data knowledge needed: Query data is data that you get by asking for specific information from database. For example, you may be able to select data by demographic categories such as age or geographic location). This data may be specifically what you need, but you will often have to interpret the data yourself.
- Advanced: When data is in a raw format, you will have to do your own calculations and interpretation. The benefit of raw data is that you can better customize the data to elicit the information you need.
Patterns are often more helpful than individual data points. As you review what you have, pay attention to the findings:
- What shows up again and again?
- What feels consistent across sources?
- What stands out or surprises you?
Gaps are not failures. They help you understand where to focus next. For example,
- What do we not know yet?
- What feels unclear or incomplete?
- Where do different data sources seem to tell different stories?
Keep feasibility in mind. As you look at the data, make notes when you notice something that:
- The team thinks it could realistically influence
- Small changes would make a big difference
- The type of work that would need to be done is within the team’s expertise and current capacity
This helps prevent choosing work that feels important but is not doable right now.
Before creating new surveys, tools, or tracking systems, pause and ask:
- Do we already have what we need to help answer our questions?
- Could we use existing data in a new or more focused way?
- Would collecting new data add clarity — or add burden?
New data collection should be purposeful and limited. If you decide to collect something new, start small and be clear about how you plan to use it.
Tools and resources
Here are a few additional, optional, tools that might help as you work through the Guidance and Questions to Ask.
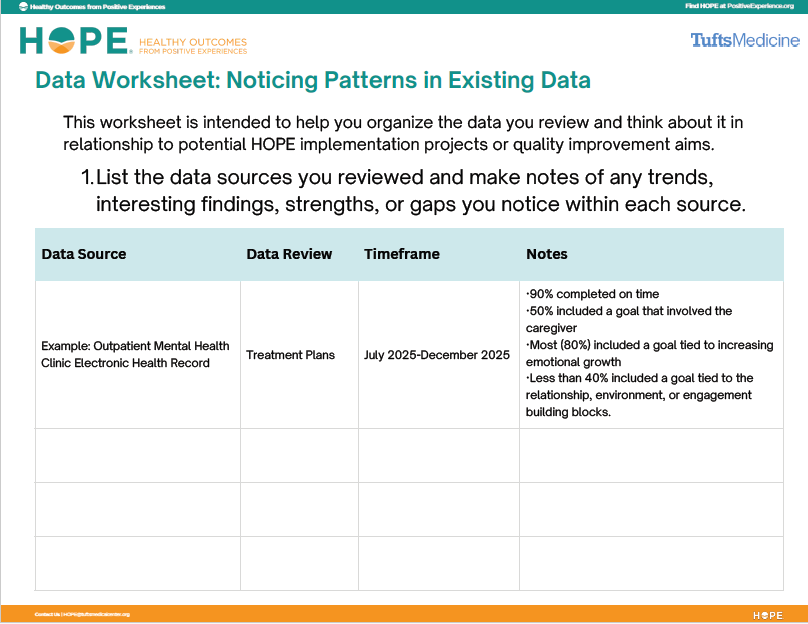
Data worksheet: Noticing patterns in existing data
Reflection prompts
What did we notice?
- What information stood out the most?
- What felt consistent across different data sources?
- What surprised us?
How did we feel about what we noticed?
- What felt validating or affirming?
- What felt uncomfortable or concerning?
- Where did people feel hopeful? Stuck?
What does this mean for us and our work?
- What might this data be telling us about what families or staff are experiencing?
- Where might small changes make a difference?
- What feels important and doable right now?

In practice: Looking at the data
Riverside Middle School had clarified their readiness and limits. They had not yet selected a project or written an Aim Statement, but they had agreed to start small and focus on relational work that fit within existing roles.
Riverside reviewed data they already had access to during a one-hour working meeting. This included attendance records by grade, mental health referral logs, discipline data, and staff observations. Counselors and teachers also shared anecdotal insights from their day-to-day work with students.
The group looked for patterns across sources and quickly noticed that the same group of students appeared repeatedly in both attendance and referral data. In many cases, attendance concerns surfaced before referrals escalated.
This helped the group shift their focus. Instead of asking why students were missing school, they began asking where connection might be breaking down earlier in the process. The data suggested that earlier, relational responses could be an important leverage point.
Keep going!
You’ve reviewed existing data and noticed patterns, strengths, and questions. Rather than trying to address everything at once, the next step is to choose one area where focused action could make a difference.
You’re ready to move on if:
- You can describe key patterns, strengths, or gaps in your data
- You’ve identified what feels most meaningful or actionable