
Section 5: Choose your data sources

Is this section for me?
After identifying an Aim Statement, we recommend organizations continue onto this section for guidance on choosing outcome measures and data sources that will help them know if they are achieving their goal. However, some organizations may have already identified their measures and data sources. Before beginning this section, let’s see if you have already completed it.
- Chosen an implementation project?
- Developed your Aim Statement?
- Identified 3-4 outcome measures to measure progress towards your Aim Statement and the impact of your implementation project?
- Confirmed at least one of the outcome measures aligned with at least one of the HOPE outcome domains (Access to positive childhood experiences in the short term, Provider–family relationships, Family/child outcomes, Staff outcomes)?
If so, you’ve completed this step and can move onto the next section, Develop your implementation plan, or you can read this section to confirm you are satisfied with your data sources.
Introduction to choosing your data sources
In quality improvement work, measures help answer a simple question: Are the changes we are making helping us move toward our aim?
Good measures are:
- Clearly connected to the Aim Statement
- Sensitive enough to show change over time
- Realistic to collect and review
Many teams assume evaluation requires creating new tools or systems but may already be collecting useful information. The key step here is to choose a few, small ways to see whether your work is moving you in the right direction.
How this step fits into the larger QI process
Once you have chosen an implementation project and written an Aim Statement, the next step is to decide what to pay attention to over time. You may have already been thinking about this as you wrote your aim statement and decided what changes you hope to see.
This step helps teams:
- Stay focused on what matters most
- Avoid collecting data that won’t be used
- Build evaluation into the work rather than adding it on later
Choosing data sources and measures:
- Clarifies what “progress” means for your project
- Supports learning and adjustment during implementation
- Informs action planning and testing changes
- Helps teams tell a clear story about impact
Guidance and questions to ask
Brainstorm answers related to your Aim Statement
Your measures should flow directly from your Aim Statement.
- What are we trying to change?
- Who is this change for?
- How will we know if things are improving?
Think about data that would help you answer each of these questions. Make a list of possibilities. These ideas should align with the HOPE outcome domains you identified when you chose your implementation project:
- Access to positive childhood experiences in the short term
- Provider–family relationships
- Family/child outcomes
- Staff outcomes
Map these ideas onto data you already have
Existing forms, logs, reports, or systems can often be used, or slightly adapted, to support evaluation. Looking at your ideas to the three questions above, how do they align with…
- Data you are already collecting?
- Data staff already tracks as part of their work?
- Data we already report for other purposes?
- Data our partners collect and/or have access to?
Some examples might include demographic information, service utilization rates, mental health or physical symptoms, average timeframes for services, retention rates, staff satisfaction, referral follow-through waitlist numbers, and academic records.
These data sources can act as a low-lift way to measure progress towards your Aim Statement and impact of your implementation project.
Pause before collecting new data
It is also important to note ideas for which you do not have access to relevant data. Before adding or creating additional tools or tracking systems, pause and ask:
- Can we sufficiently answer our question with data we already collect?
- Could a small change to an existing process give us what we need?
- Will this data add to what we learn and help us make decisions?
New data collection should be purposeful and limited. If you decide to collect something new, start small and be clear about how it will be used.
Choose outcome data measures to measure impact
After reviewing existing data, considering new data, and comparing these ideas against your Aim Statement, choose your final list of measures.
- Confirm your measure aligns with HOPE implementation: At least one of your outcome measures should be related to:
- Access to positive childhood experiences in the short term
- Provider–family relationships
- Family/child outcomes, and/or
- Staff outcomes
- Limit your number of measures: More data does not always lead to better learning. Three or four outcome measures are typically sufficient for a quality improvement project. If you are having difficulty narrowing your list down, consider:
- What is the minimum information we need to understand whether we are making progress?
- If we could only track one or two things, what would be most helpful?
- Be sure that your data measures outcomes, not just processes: While data that tracks the number of individuals served or that shows you completed a step in the process can be useful, it will not help you determine whether you are making progress towards your aim statement. This type of data – process data – should be collected in addition to outcome data, not instead of it.
- Be realistic about capacity: If a measure feels burdensome – for either staff or individuals served – it is unlikely to be sustained. Check in to see if the measures you have chosen are realistic given everyone’s capacity. Ask:
- Who will collect this data?
- How often does it make sense to review it?
- Does this feel doable alongside existing responsibilities?
Tools and templates
Here are a few additional, optional, tools that might help as you work through the Guidance and Questions to Ask.
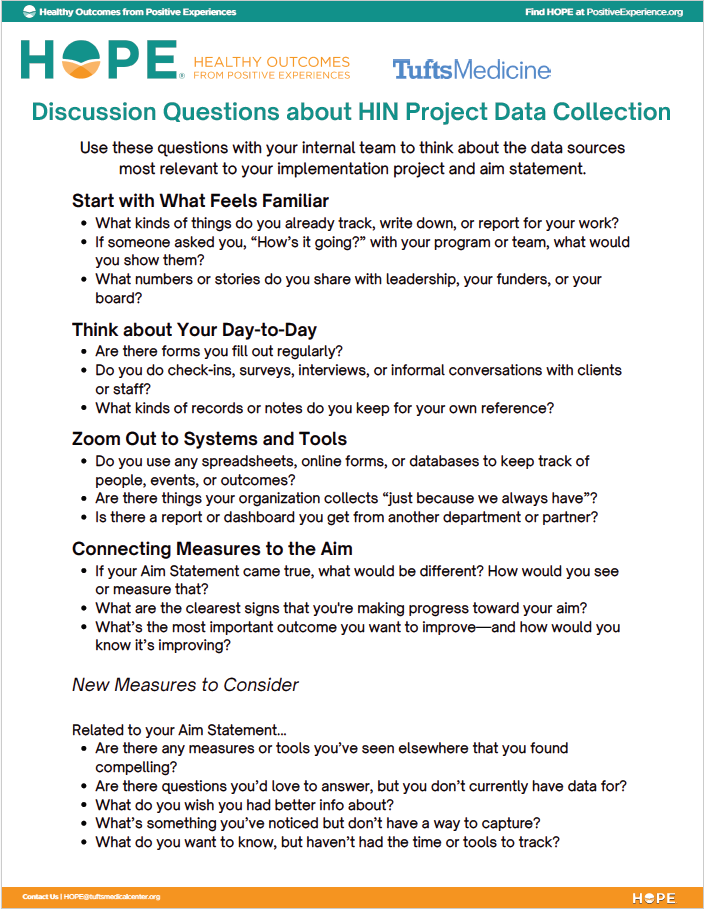
Data collection discussion questions
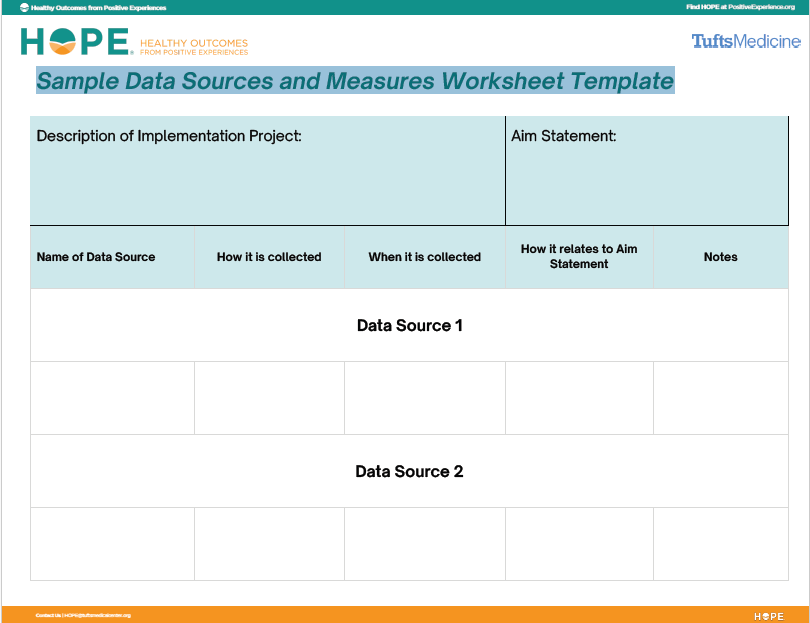
Sample data sources and measures worksheet template
Sample Outcome Measures
There are countless ways to measure the different types of HOPE implementation outcomes. A few are listed below for each outcome category to help you get started thinking about measures you already collect or might like to collect. A list of helpful child and family related measures is also available from the Institute for Child Success.
Access to positive childhood experiences in the short term
- Participation or engagement data (e.g., attendance, program completion)
- Frequency of activities that address at least one Building Block of HOPE
- Partner engagement in addressing Building Blocks
- Grant and funding opportunities that directly address at least one Building Blocks
Provider–family relationships
- Health Care Relationship (HCR) Trust Scale
- Patient-Doctor Depth-of-Relationship Scale
- Participation or engagement data (e.g., attendance, program completion)
- Percentage of follow-through on referrals
- Attendance rates
- Treatment adherence
- Client or caregiver satisfaction surveys
Family/child outcomes
- Parenting Stress Index
- Strengths and Difficulties Questionnaire
- Behavioral incident reports or disciplinary referrals
- Mental or physical health symptom scales
- School belonging or connectedness scales
- Placement stability, reunification progress, or case milestones
Staff outcomes
- Retention rates
- Participation in employee engagement events
- Employee engagement surveys
- Job Satisfaction Questionnaire
- Professional Quality of Life (ProQoL) tool
- Oldenburg Burnout Inventory
Reflection prompts
Before moving forward, ask:
- Do these measures clearly connect to our aim statement?
- Do these measures give us meaningful information, not just “easy to count” data?
- Can we realistically collect and review this data?
If the answer to any of these is “no,” revise your list of measures before proceeding.
In Practice: Choosing Data Sources
At this point, Riverside Middle School had:
- A written an Aim Statement
- A clearly defined population
- A focused implementation project tied to intakes and referrals
They were ready to decide how they would know whether their work was making progress.
The Riverside team began by returning to their aim statement and walking through three simple questions together during a working meeting:
What are we trying to change? They named two related changes:
- Reducing chronic absenteeism among a specific group of 6th-grade students
- Strengthening students’ sense of connection to at least one adult at school
Who is this change for? The focus was intentionally narrow:
- A small group of identified 6th-grade students
- Staff members directly supporting them (counselors and mentors)
How will we know if things are improving? Rather than jumping straight to tools, the group talked about what improvement would look like:
- Students attending more consistently
- Fewer escalated mental health referrals
- Students reporting stronger connection to adults
- Staff feeling supported rather than stretched
Only after this conversation did they begin identifying data. The team first mapped these ideas to data they already had access to:
- Attendance records by student
- Referral logs
- Counselor caseload counts
They then noted where existing data fell short. Attendance told them what was happening, but not how students were experiencing school. To address this gap, they decided to add one brief student measure focused on belonging, administered once when the student’s attendance concerns were identified and once in May, towards the end of the school year.
They followed the same process for staff outcomes. Rather than surveying all staff, they focused on those most involved in the change – identified as school counselors, social workers, and adult mentors – and chose a single, validated tool to understand whether the project impacted levels of staff wellness. This measure would be administered once at the beginning of the project and once in May, towards the end of the school year.
By the end of the meeting, Riverside had selected:
- Attendance rates for participating students
- Documentation of mentor check-ins (process)
- Student belonging (measured pre/post)
- Staff well-being for involved staff only
The group agreed they could always add measures later if needed, but starting small would help them learn more clearly.
Keep going!
You’ve decided how progress will be measured. Now it’s time to translate your aim into action. An implementation plan outlines the practical steps your team will take to move the work forward.
You’re ready to move on if:
- You have identified data that aligns with your Aim
- Your measures feel realistic and feasible to collect
- You are clear on what success will look like in your data